Driving Compliance and Quality in Aseptic Manufacturing: ISO 14644-7
 Introduction
In our prior article in this series , we analyzed the technical rationale behind ISO 14644-7:2004 Annex E.5.3, clarified the relationship between test pressure and sensor accuracy, and highlighted the need for experimental validation (PQ) of detection limits. This article takes the next step: how to select appropriate leak simulation tools, and what real-world test data reveals about pressure decay across different hole sizes.
Note: The views expressed here are based on our own experimental data and technical experience. We welcome feedback and corrections.
Question 1: Why Must We Use Rigid Standard Holes?Limitations of Micro-Needle Puncture
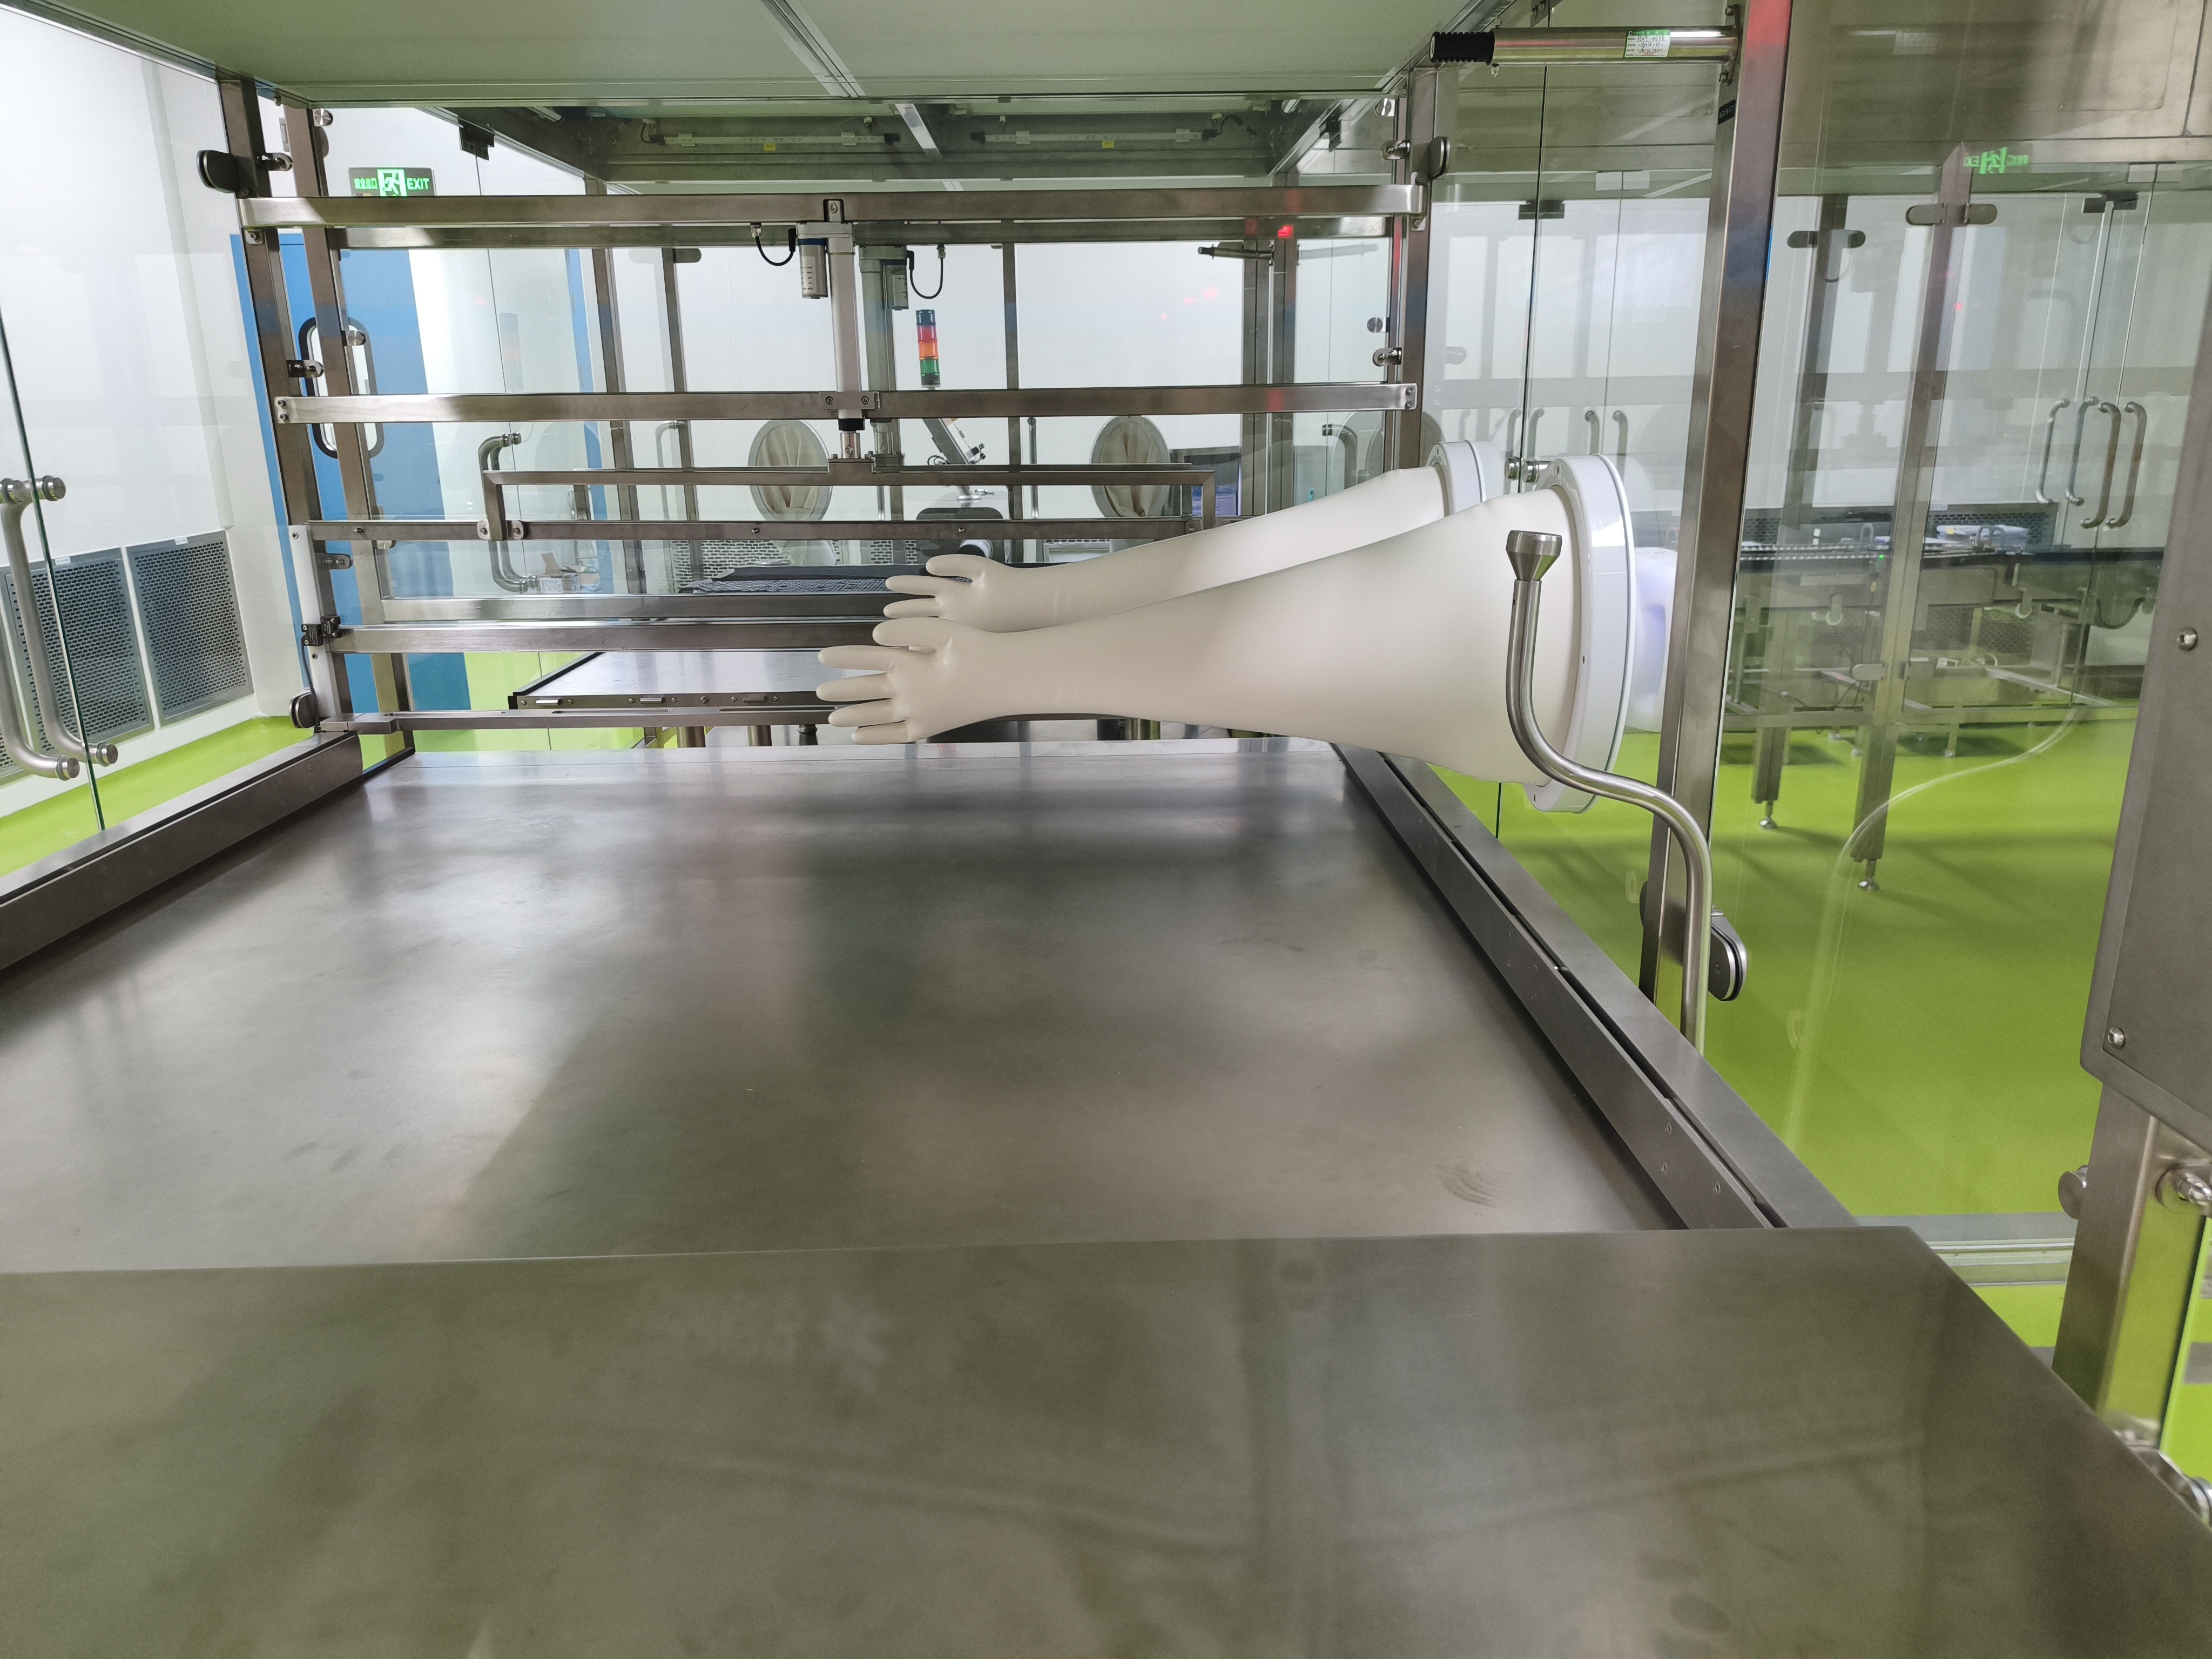
A common approach to simulating leaks is puncturing gloves with micro-needles of known diameter. However, this method has a fundamental flaw: glove materials are elastomers (Hypalon, Butadyl, Neoprene, EPDM, etc.), and the puncture hole partially closes due to material rebound after the needle is withdrawn. During inflation, the hole deforms again under pressure. The actual leak diameter is neither equal to the needle diameter nor to the initial puncture size - it is an uncertain value.
This directly violates the core principle of PQ validation: the calibration standard must be known and deterministic. If the leak simulation tool itself has an uncertain hole size, the validation conclusion is meaningless.
Advantages of Rigid Standard Holes
To address this, we use stainless steel rigid standard leak holes. The key advantage is that the hole diameter is fixed, unaffected by test pressure, and does not change with material deformation - making it a truly traceable calibration standard.
Question 2: Drilling vs. Laser - How to Choose?Two common fabrication methods for creating standard holes in rigid materials are precision drilling and laser drilling. Each has its applicable scenarios:
Laser drilling can achieve smaller hole diameters (50-80 μm) with no mechanical contact and no burrs. However, laser drilling has strict material thickness limitations - precision is typically only guaranteed on substrates thinner than 0.05 mm. Thin membranes deform under pressure, causing the hole diameter to change, which fundamentally reintroduces the problem of uncertain hole size.
Precision drilling can create holes in thick-walled stainless steel, ensuring a rigid bore that does not deform under test pressure. While the minimum achievable diameter is approximately 100 μm, for PQ validation purposes, stability and repeatability are more important than achieving the smallest possible hole size.
✅ Core principle: Regardless of fabrication method, the primary requirements for a standard leak hole are dimensional stability, traceability, and repeatability - not the pursuit of the smallest possible diameter.
Standard Leak Hole Design
Our standard leak holes feature a stainless steel plug body with a hardened silicone O-ring seal and a precision-drilled through-hole at the center. Available nominal diameters include: 100 μm, 150 μm, 200 μm, 250 μm, and 300 μm.
Nominal vs. Measured Values
It should be noted that mechanical drilling inherently involves manufacturing tolerances, and deviations between nominal and actual hole diameters are expected. Each standard leak hole is independently measured before delivery, and PQ validation uses measured values rather than nominal values. This is essential for ensuring traceability of validation data.
Test Data and Analysis
The following data is based on tests conducted at our laboratory. Test conditions: temperature 22±3°C, relative humidity 45-65%, inflation pressure 1000 Pa. Testing covered multiple glove materials and models.
Note: All test data excludes the first two cold-start records after equipment power-on to eliminate the impact of temperature drift during the warm-up phase.
Pressure Decay Across Different Hole Sizes
The table below shows average pressure decay (ΔP) for each hole diameter under a 60-second test duration:
Hole Size | Tests | Mean ΔP | Std Dev |
0 mm\n(Baseline) | 71 | 21.1 Pa | 8.9 Pa |
0.1 mm | 37 | 32.4 Pa | 12.6 Pa |
0.2 mm | 47 | 44.4 Pa | 10.0 Pa |
0.3 mm | 42 | 60.5 Pa | 40.5 Pa |
The data clearly shows that larger holes produce greater pressure decay. The ΔP for 0.3 mm is approximately 2.9x the baseline, and 0.2 mm is approximately 2.1x.
It is important to note that all the data presented above was collected on our previous-generation technology platform. Under short 60-second test conditions, the signal-to-noise ratio for 0.1 mm holes (SNR approx 1.3) may appear to be near the detection boundary. However, through optimization of key parameter combinations including stabilization time and test duration, reliable 100 μm leak detection has been achieved on this platform. This demonstrates that well-designed parameter optimization can effectively compensate for signal-to-noise limitations.
Our new-generation technology platform incorporates system-level optimization in airtight integrity, thermal management, and sealing structure, effectively reducing background noise. Testing has verified that the new platform achieves significantly improved repeatability for 100 μm detection with greater parameter tolerance. This further reinforces a core point: detection limits are the combined result of parameter optimization and hardware platform design - system-level factors such as airtight integrity, internal thermal distribution, and sealing structure are equally important as test parameters.
Question 3: How Do Stabilization Time and Test Duration Affect Detection?This is an often-overlooked but critically important factor in positive pressure decay testing. Our test data reveals a key phenomenon:
Natural System Decay: The Background Noise That Cannot Be Ignored
Even with a perfectly intact glove (0 mm baseline), the system produces pressure decay. This is caused by elastic creep of the glove material, temperature fluctuations, and micro-permeation through the sealing system. The key finding is that this natural decay rate is highest in the early phase of testing and gradually decreases over time.
Test Duration | Avg ΔP | Decay Rate | Trend |
60 s | 21.1 Pa | 0.35 Pa/s | ↑ Highest |
90 s | 24.6 Pa | 0.27 Pa/s | ↓ |
120 s | 28.9 Pa | 0.24 Pa/s | ↓↓ |
180 s | 43.0 Pa | 0.24 Pa/s | ↓↓ |
360 s | 56.9 Pa | 0.16 Pa/s | ↓↓↓ Stabilizing |
Decay rate represents total ΔP divided by test duration for 0 mm baseline. Actual rates are influenced by equipment platform thermal stability, internal heat generation, and sealing performance.
What Does This Mean for Small Hole Detection?
When the natural system decay rate is high, the leak signal from small holes is masked by background noise. For example, with insufficient stabilization, the ΔP from a 0.1 mm hole is virtually indistinguishable from the baseline. As stabilization time increases, background noise decreases and the leak signal emerges.
This explains why detection capabilities vary dramatically across different equipment on the market. It is not only about sensor accuracy - the thermal stability of the equipment platform, sealing structure design, and optimization of test parameters all directly impact the ultimate detection limit.
Impact of Test Duration
Test duration also affects detection results. Longer test times allow leaks to produce greater cumulative pressure drops, improving the signal-to-noise ratio. However, extended test times also increase cumulative natural system decay, so an appropriate balance must be found.
Hole Size | 60s ΔP | 120s ΔP | 180s ΔP | 360s ΔP |
0 mm (Baseline) | 21.1 Pa | 28.9 Pa | 43.0 Pa | 56.9 Pa |
0.1 mm | 32.4 Pa | 61.3 Pa | 63.0 Pa | 146.7 Pa |
0.2 mm | 44.4 Pa | 74.7 Pa | 119.8 Pa | 225.1 Pa |
0.3 mm | 60.5 Pa | 100.3 Pa | 125.4 Pa | 418.4 Pa |
This means that different detection targets require different parameter combinations. For larger holes (e.g., 200 μm and above), shorter stabilization times and test durations can provide sufficient signal-to-noise ratio. For small-hole detection at the 100 μm level, longer stabilization times are needed to reduce background noise, combined with appropriate test durations to accumulate sufficient leak signal. Parameter settings should not be fixed, but optimized according to the specific detection target.
ConclusionsConclusion 1: Micro-needle puncture cannot provide a deterministic hole diameter due to elastic material rebound and inflation effects, making it unsuitable as a PQ validation standard. Rigid standard holes are the more reliable choice.
Conclusion 2: Sensor accuracy and range selection are the fundamental prerequisites for small-hole detection (see Series Part 1). Current differential pressure sensors typically achieve 0.02% FSV accuracy. Range selection directly determines effective resolution - for example, at the same 0.02% FSV accuracy, a 10 kPa range yields an effective resolution of ±2 Pa, while a 100 kPa range becomes ±20 Pa, the latter already exceeding the signal strength of a 100 μm hole under 60-second testing (11.2 Pa). An inappropriate range fundamentally renders detection meaningless. Furthermore, sensors must be calibrated with reference standards before deployment to ensure stated accuracy is reliable. Beyond this foundation, detection limits further depend on test parameter optimization and hardware platform design. Our previous-generation platform achieved reliable 0.1 mm detection through parameter optimization; our new-generation platform, with system-level improvements in airtight integrity, thermal management, and sealing structure, further enhances the repeatability and parameter tolerance of 0.1 mm detection.
Conclusion 3: When selecting equipment, companies should require suppliers to provide PQ validation data based on rigid standard holes, rather than relying solely on sensor specification sheets or software resolution to evaluate detection capability.
What's NextThe next article will discuss how to establish a complete PQ validation protocol for glove integrity testing, including validation workflow design, statistical analysis methods, and acceptance criteria development. Stay tuned.
Follow us:
This article is an original work by BIODECONTA Innovation Inc. All rights reserved. No part of this publication may be reproduced, excerpted, or used for commercial purposes without prior written permission. The technical content herein is for reference only and may be updated or modified over time without prior notice.
Please contact: marc@biodeconta.com
Related Products